Debugging Programs
Debugging
In order to debug a COBOL program, you first need to run a build task with appropriate debug options. Once this is done, you can launch the compiled program in a debugging session.
You can learn more about SuperBOL build tasks in the Building Programs chapter.
We recommend that a version of GnuCOBOL that is at least as recent as version 3.2 be available on the system running VS Code. Debug and coverage features respectively assume that gdb and gcov are installed.
On Windows systems, users may employ dedicated installers that are available here. Linux users may rely on their favorite package manager and install gnucobol.
Launching the Compiled Program for Debugging
If needed, you can place a breakpoint on statements (or paragraph titles in the procedure division) by clicking on the red dot that appears when you hover the cursor on the left margin (or with F9). Click on the red dot or press F9 again to remove a breakpoint. Then, to launch the program in debug mode, select Run > Start Debugging (F5). This will run your program until a first breakpoint if reached, or to completion.
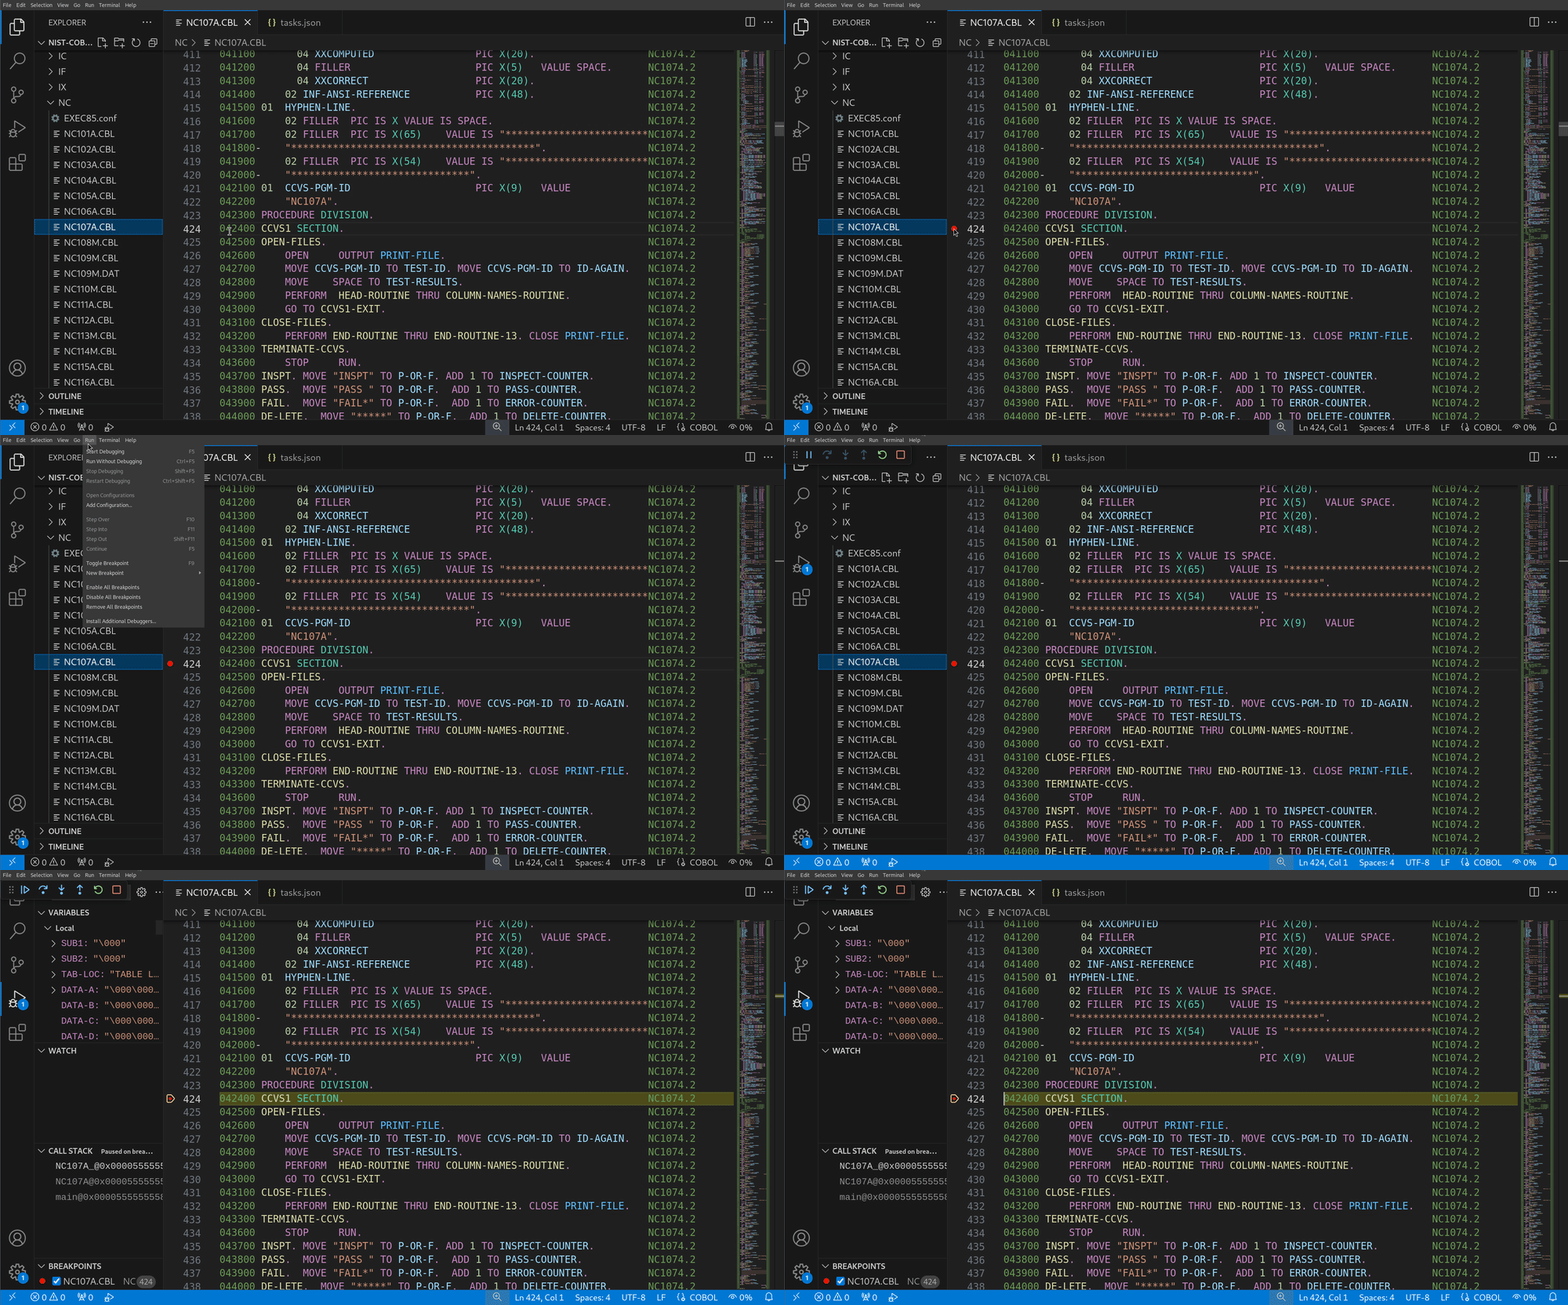
Once stopped on a breakpoint, you can investigate the values of data items from the program using the VARIABLES panel on the left-hand side.
Press F10 to step to the next statement, or F5 again to continue until the next breakpoint, or termination of the program.
SuperBOL debug configurations
SuperBOL can handle several debugging scenarios, such as launching a program to debug it, attaching to a running process or even attaching to a remote process to debug it.
In order to select which scenario SuperBOL should run, you have to provide a list of configurations stored in the .vscode/launch.json file. This file can be generated with the following steps:
Open the
Run and Debugpanel (Ctrl+Shift+D)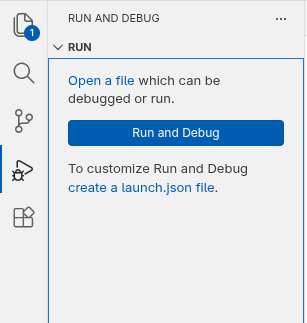
Run and Debug Click the
create a launch.json filelink. If you don’t have this view, this means that you already have such a file, you should be able to open it now, and skip this setup.A list of presets will be presented, you should select the
SuperBOL Debugger for GnuCOBOL.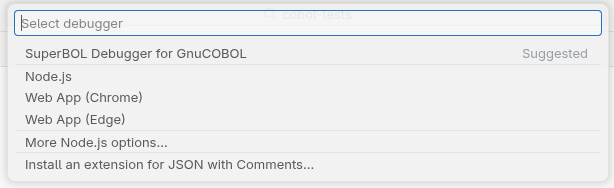
The
.vscode/launch.jsonwill be generated with preset configurations provided by superbol:{ // Use IntelliSense to learn about possible attributes. // Hover to view descriptions of existing attributes. // For more information, visit: https://go.microsoft.com/fwlink/?linkid=830387 "version": "0.2.0", "configurations": [ { "name": "SuperBOL: debug (launch)", "type": "superbol-gdb", "request": "launch", "preLaunchTask": "SuperBOL: build (debug)", "target": "${file}", "arguments": "" }, { "name": "SuperBOL: debug (attach local)", "type": "superbol-gdb", "request": "attach", "pid": "${input:pid}", "target": "${file}" }, { "name": "SuperBOL: debug (attach remote)", "type": "superbol-gdb", "request": "attach", "remoteDebugger": "${input:remoteDebugger}", "target": "${file}" } ] }
With those presets, you can handle the different scenarios presented earlier:
"SuperBOL: debug (launch)"to compile the currently opened program, and to rungdbon the compiled program."SuperBOL: debug (attach local)"will ask you for apidto attach thegdbdebugger to, and use the currently opened COBOL file as the source code of the attached process."SuperBOL: debug (attach remote)"will ask you for an adress and port to connect to a remote debugger, withgdbserver, and use the currently opened COBOL file as the source code of the remote process.
In all the scenarios presented, you must have the COBOL source on your local system, and have the program you wish to debug opened in your editor.
For the "SuperBOL: debug (attach remote)" configuration, the remote server should have gdbserver installed and available.
To select which configuration to use to debug your program you should:
Open the
Run and Debugpanel (Ctrl+Shift+D)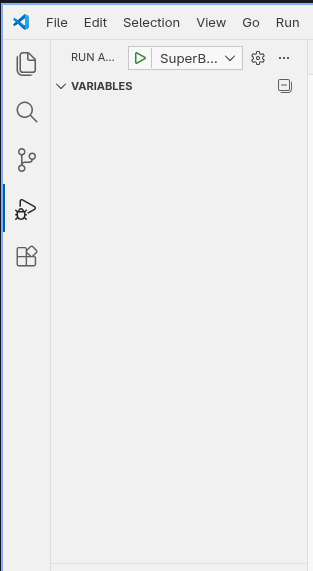
Select the configuration in the dropdown menu at the top of the panel
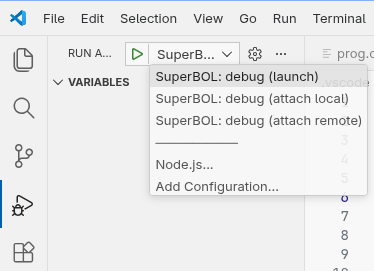
To start your debugging you can then press the F5 key. The configuration you selected should be run by default.
Both remote configurations needs input to successfully launch, this requires some manual configuration, which is explained in the next section.
Managing configuration inputs
As you may have noticed, some fields in the SuperBOL configurations have an ${input:<identifier>} parameter. This means that you must provide an input when the configuration is launched.
VSCode does not provide a way to automatically configure those inputs so you must write some configurations yourself. In order to setup those inputs, you should:
Open the
.vscode/launch.jsonfileAdd an
inputsarray in the file:{ "version": "2.0.0", "configurations": [ ... ], "inputs": [] }In this array, add every input needed by the debug configurations, in our case they are
"pid"and"remoteDebugger"(you can only add one of both if you don’t intend to use both of them.) Your inputs array should look like so:{ "inputs": [ { "id": "pid", "type": "promptString", "description": "PID of process to attach to." }, { "id": "remoteDebugger", "type": "promptString", "description": "Address of the remote debugger." } ] }In this array, each objects have the same fields, with different values:
"id": The identifier of the input, must be the same as the identifier on the right of the${input:<identifier>}in your configuration."type": The type of input to provide, here"promptString"means you will be asked to input a string before the configuration can be launched."description": A small description of the input to provide.
Now when you use the "attach" configuration VSCode will ask you for the corresponding input.
Customizing the debug configurations
The presets configurations might not be suited to your use case, but you can customize them to fit your needs.
To customize your debug configuration, you can either edit the presets or add a new one in the .vscode/launch.json file. Here are the fields you can add or edit in the configurations:
"name"(mandatory): The name of the configuration, you can set it to the name you wish."type"(mandatory): This is the only constant field, that should always be set to"superbol-gdb"."request"(mandatory): This should be either:"launch": this means that the debugger will run over a target that it launches"attach": this means that the debugger will attach to an already running process
"preLaunchTask": This field indicates which task should be run before a"launch"request. This should be set to the label of the build task that should be run before launching the debugger. You can check Configuring a build task for more informations on those task."target": Path to the program to be debugged. You can set it to"${file}"to debug the program that is opened in your editor"arguments": An array of arguments that should be passed to the debugged program. In an"attach"request, these arguments will be passed only when the programs restarts."cwd": The directory from which the debugger should be started"env": An object containing environment variables, for example:{ "COB_LIBRARY_PATH": "/usr/lib/cobol/modules" }"useCobcrun": Use a cobol module loader, you can specify the loader to use in"cobcrunPath"."cobcrunPath": Path to the cobol module loader,"cobcrun"by default"sourceDirs": An array of path to specify where to look for the source code. When this array is not provided, only the current directory is concidered.
Some options are specific to a type of "request":
in
"launch"requests you can set:"gdbtty": This field enable you to use a different terminal for the COBOL input and ouput. It can be set tofalseto use the integrated debug terminal,trueto use an external terminal, which is choose fromxterm,gnome-terminal,xfce4-terminal, orkonsole. You can also set the field to one of the following string:"vscode": Use VSCode terminal."xterm","gnome-terminal",xfce4-terminal","konsole": Use the terminal specified by the string."external": Use one of previously listed terminals, the first one that is available to be executed will be used.
in
"attach"requests you can set:"pid": The PID of the program to be attached. You should use an${input:<identifier>}variable if the PID of the program is not constant."remoteDebugger": Address ofgdbserver, in a"host:port"format.
Example of debug configurations
These different configurations are in the "configurations" array of your .vscode/launch.json file.
Debug a GnuCOBOL module, with a custom cobcrun path
{
    // Custom name for the configuration
    "name": "SuperBOL: debug (module)",

    "type": "superbol-gdb",

    // The debugger will launch `cobcrun`
    "request": "launch",

    // We use a task to build a GnuCOBOL module with debug info
    "preLaunchTask": "SuperBOL: build (module + debug)",
    "target": "${file}",

    // Use a GnuCOBOL module loader
    "useCobcrun": true,

    // Use a specific cobcrun, given by its path
    "cobcrunPath": "/opt/gnucobol/bin/cobcrun"
}